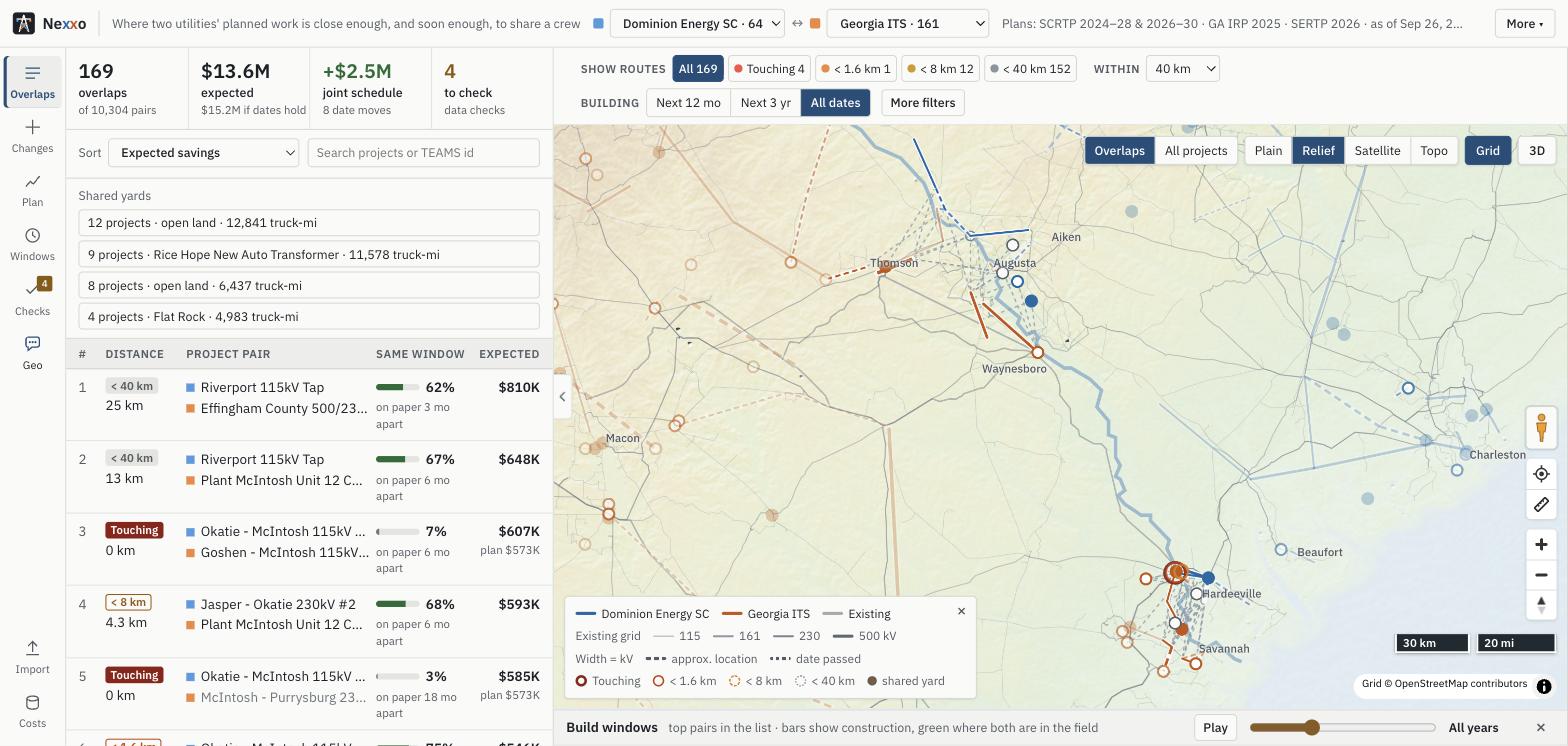
Neighboring utilities plan their transmission work years ahead, each on its own. Nexxo reads both plans, finds the projects close enough to share crews, yards and land, weighs how likely they are to be built at the same time, and says which few date changes would help most.
Project lists come straight from the published filings or any file a utility shares. Each project is placed on real substations, and validation checks flag what needs a human.

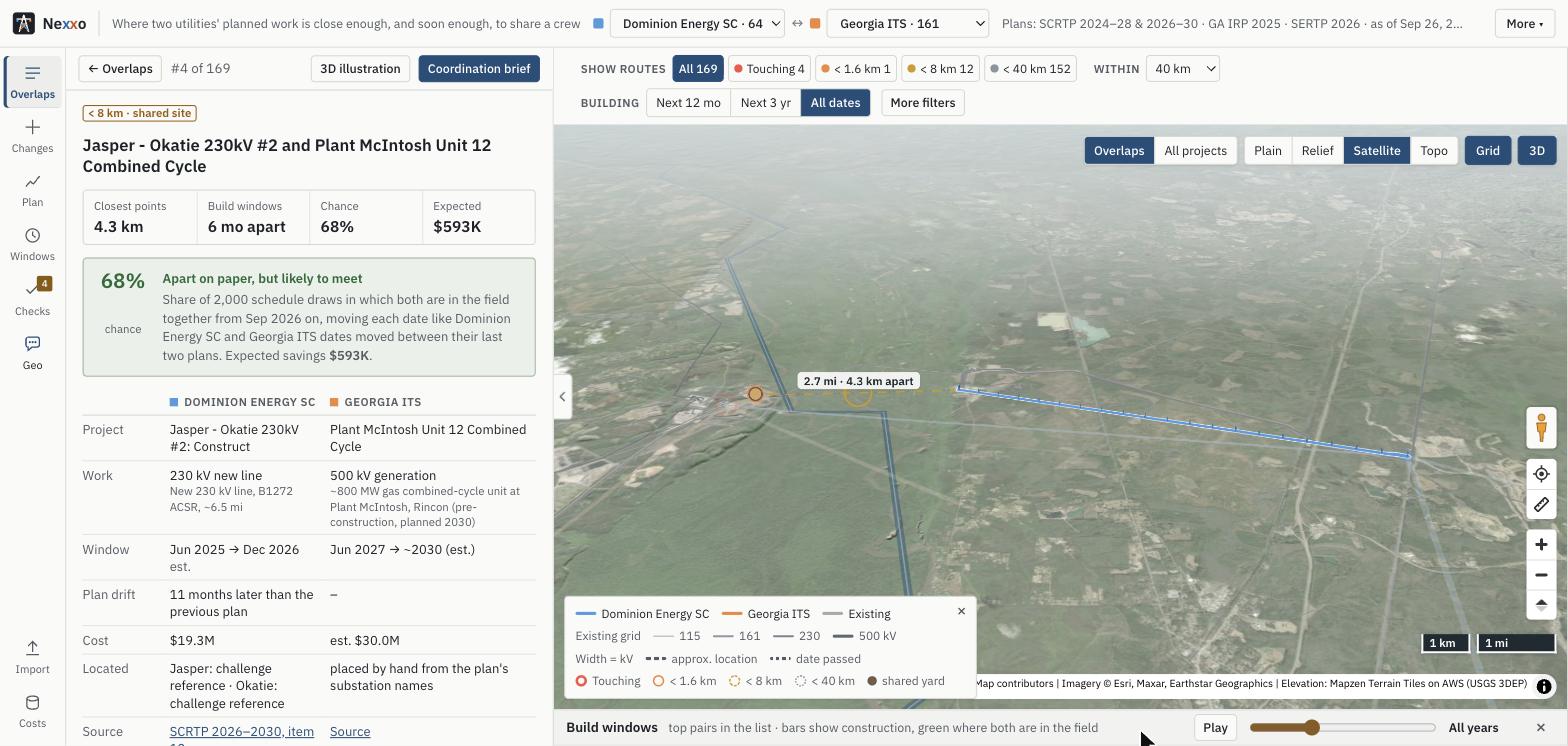
Distance is measured between the closest points, in four tiers from touching to 40 km. Comparing editions of each plan shows how dates slip, and turns that into the chance both crews are really in the field together.

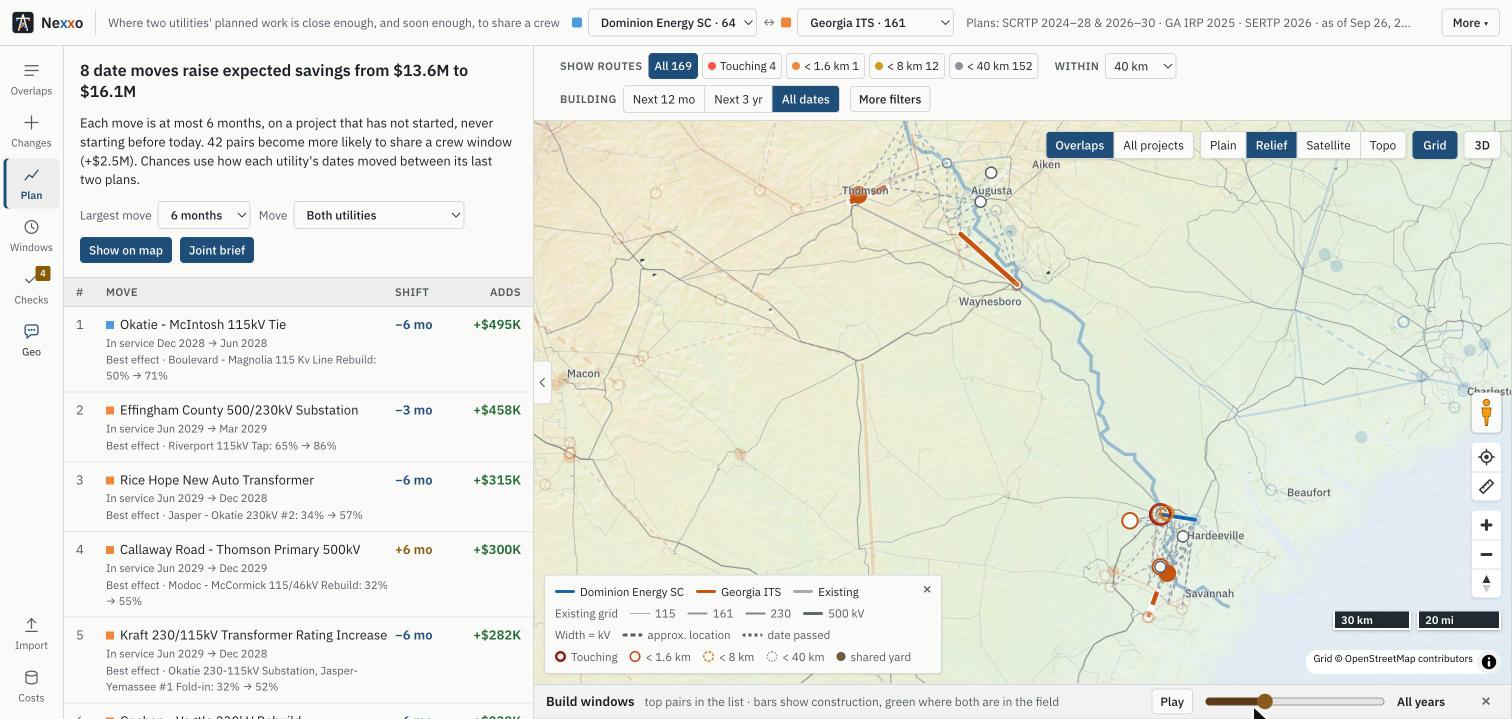
Every opportunity is priced item by item: shared right-of-way, one laydown yard instead of two, combined deliveries and crews. A schedule optimizer finds the few date moves that add the most, and prints a proposal for both teams.

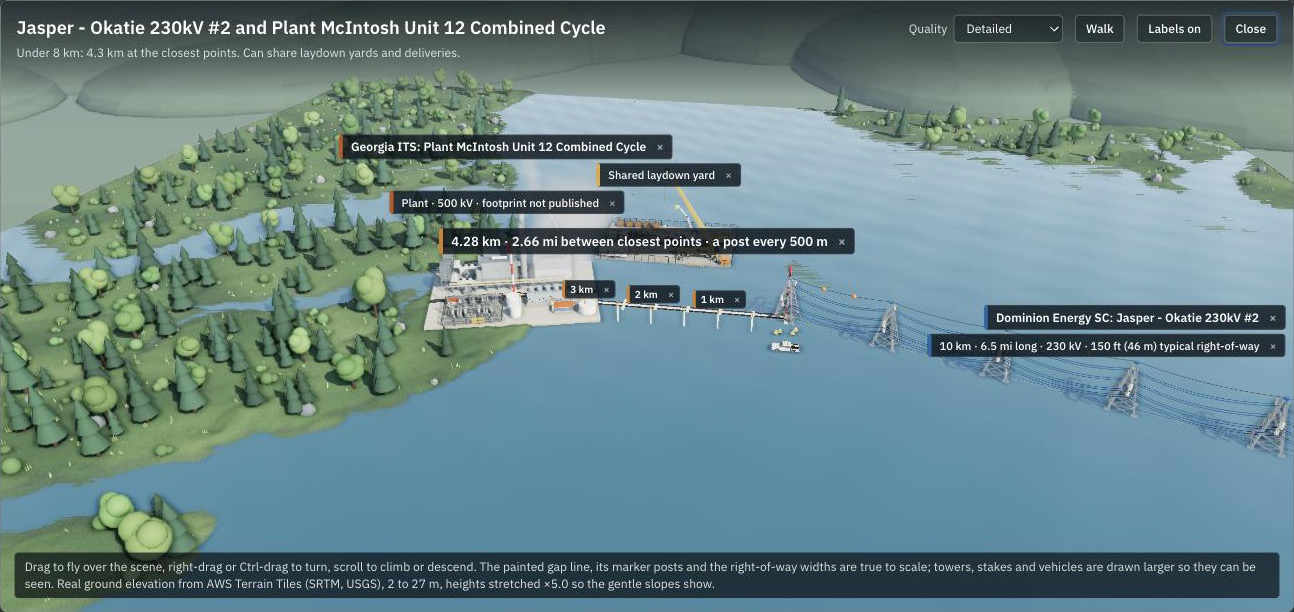
Satellite imagery over real terrain, today's grid underneath, and a 3D site you can walk. Geo, the built-in assistant, answers questions in English or Spanish.

Where two utilities' planned work is close enough, and soon enough, to share a crew
Drop the plan the way the utility published it: an Excel project list, a CSV, or GIS files (KML/KMZ, shapefile as a .zip or the .shp, .dbf and .prj together, GeoJSON). Column names are matched loosely, so owner, voltage, isd and latitude all work, and title rows above a spreadsheet's header are skipped. Tables need coordinates for each project; GIS files carry their own. Year-only dates like 2029 are fine.
Planning estimates, not quotes. Each shared item's saving is worked out from these numbers, and every pair updates when one changes. When one utility's cost is shared, each side saves its share (50% by default); a coordinated outage and a crossing designed once count in full. Check them against USDA NASS land values, the MISO Transmission Cost Estimation Guide, and local crane and heavy-haul rates.
Nexxo compares the planned transmission construction of two neighboring utilities and flags the projects close enough, and soon enough, to share crews, yards, deliveries and outages. Built at ShellHacks 2026 for the Sperry Tech GridLock challenge.
MapLibre GL JS (BSD-3-Clause), three.js (MIT), d3 (ISC), SheetJS Community Edition (Apache-2.0), @tmcw/togeojson (BSD-2-Clause), JSZip (MIT), shpjs (MIT), IBM Plex fonts (OFL), Anthropic TypeScript SDK (MIT, loaded only when a key is used). The optional assistant uses Anthropic's API with the viewer's own key.
Nexxo is a planning aid. Distances, chances, savings and schedule moves are estimates worked out from public plans and round unit costs you can edit under Costs. They are not engineering, legal or financial advice, and not quotes.
Plan data is shown as published, with the corrections the Checks tab lists. Confirm any figure with the utilities involved before acting on it.
The page is provided as is, without warranty of any kind. Map data, imagery and elevation remain subject to their providers' own terms.
Nexxo is a static web page. There is no Nexxo server and no account.
Your view settings (basemap, filters, language, the coordination status you set on pairs). An Anthropic API key, only if you add one: kept for this tab, or on this device if you tick Remember. Change key removes it.
Only when you ask Geo an open-ended question with your own key: the question and the Nexxo data Geo looks up to answer it. The example questions are answered inside the page and send nothing.
Map tiles and imagery (Esri), elevation tiles (AWS), fonts (Google Fonts), the Anthropic SDK from jsDelivr when you use a key, and, if the bundled copies fail, library CDNs (jsDelivr, cdnjs). Like any web map, they receive your IP address.
Read in your browser. Nothing is uploaded.
Illustration of the pair: distances along the ground are to scale; terrain and towers are schematic. Drag to orbit, scroll to zoom.